
10 Easy Data Analysis Methods and Techniques Every Data Analyst Needs At Work
April 19, 2021 2021-07-14 9:4010 Easy Data Analysis Methods and Techniques Every Data Analyst Needs At Work

10 Easy Data Analysis Methods and Techniques Every Data Analyst Needs At Work
The data mining industry is seeing a rapid and explosive expansion in our modern information age. The amount of data available is overwhelming. The trick is to sort through the massive amounts of data available to organizations and enterprises and appropriately evaluate their consequences. However, to filter through all of this data, you’ll need the correct statistical data analysis tools.
Whether in operations research analysis or in market research data analysis, the projections for growth are very promising. Below are our top ten (10) easy data analysis methods and techniques and how they can be beneficial to your career/organization.
Before we dive in, let’s first understand what data analysis is.
Also read:
- Data Analytics vs Data Science: What You Need To Know
- Top 5 Data Analytics Courses and Why You Need Them
- Top 5 Leading Data Science Courses to Boost Your Credentials
- 5 Tips To Pass Any Data Science Interview and Win Top Jobs
What is data analysis?
The process of studying raw data to derive actionable insights is known as data analytics. When is the most appropriate time to launch that marketing campaign? Is your team structure as efficient as it could be? Which sectors of your target market are most likely to buy your new product? Are some of the questions you should ask yourself before determining your next course of action.
How does data analytics help businesses?
The internet’s development and digital transformation have made it simple to monitor how clients respond to various products regularly. Data analysts can assist business organizations in making data-driven decisions rather than relying on consumer feedback if they have a good data set and the right strategy.
Data analysts can search for meaningful insights that lead to better products, marketing campaigns, and customer service by collecting this information in bulk.
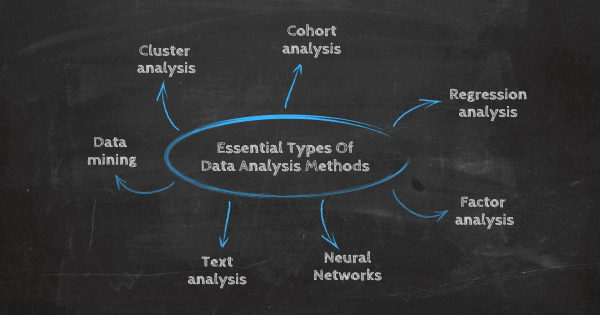
10 Data analysis methods and techniques you need to improve your understanding of business data sets
Any successful business plan relies heavily on data analytics. How do data analysts, on the other hand, turn raw data into anything useful? Depending on the sort of data and the kinds of insights they wish to unearth, here are ten easy data analysis methods and techniques data analysts employ.
Cohort Analysis
A group of people who have common characteristics over the same period of time is what is termed as a cohort. For example, customers who bought something from your online store via the app in the same month could be considered a cohort.
Cohort analysis is a subset of behavioral analytics that takes data from a dataset and divides it into related groups for study rather than looking at all users as a single unit. Companies can use cohort analysis to improve their service offerings and marketing to give customers a more personalized experience.
Sentiment analysis
Sentiment analysis is a highly helpful qualitative approach that falls within the broader genre of text analysis which is the typically automated process of sorting and comprehending textual material. The purpose of sentiment analysis is to interpret and categorize the emotions expressed in textual data. This lets you determine how your customers feel about various parts of your brand, product, or service from a commercial point of view.
As a business, you should not underestimate the significance of qualitative data. What people (especially customers) on different platforms write and say about you can provide you with a wealth of information.
Monte Carlo simulation
When the stakes are high, it’s critical to assess all the potential risks and rewards as thoroughly and accurately as possible. Monte Carlo simulation, often known as the Monte Carlo method, is a computational approach for creating models of potential outcomes and associated probability distributions.
It evaluates a variety of conceivable outcomes before calculating the likelihood of each one occurring. Data analysts employ the Monte Carlo approach to perform an advanced risk analysis, which allows them to better predict what will happen in the future.
Descriptive analysis
The descriptive analysis provides a historical context. This statistical technique examines data and analyzes past occurrences and scenarios for developing a concept of how to approach the future. It enables us to learn from previous behaviors and determine how they may affect future performance.
Regression analysis
This is one of the most common forms of data analysis methodologies used in business, data-driven marketing, financial forecasting, and other areas is regression. This method of analysis looks for correlations between independent and dependent variables. Regression analysis can be used to discover correlations between different product prices and the number of units sold.
There are many distinct types of regression models, including linear regression models, multiple regression models, logistic regression models, ridge regression models, nonlinear regression models, life data regression models, and many more.
https://www.youtube.com/watch?v=BlzR2PjZSdY
Factor analysis
This is a sort of regression analysis that searches for hidden factors that may influence variables. It is based on the idea that multiple observable variables are related because they are all linked to the same underlying construct. This is beneficial not only because it condenses large datasets into smaller, more manageable samples, but also aids in the discovery of hidden information.
Discriminant analysis
In data mining, this is one of the most dominant classification techniques. Variable measurements on various groups of items are used in discriminant analysis to highlight areas that differentiate the groups. This method classifies comparable data objects into clusters or groupings, in which each member has more similarities than differences.
By gathering similar customers and describing what they have in common, cluster data visualizations can assist you in identifying trends in your client base.
Dispersion analysis
Although dispersion analysis is not often employed in data mining, it does play a role. It is the spread to which a set of data is spread and It is a way of expressing how extensive the data is.
Time series analysis
You’re probably aware that measurements are carried out over time in practically every scientific field. Time series analysis is the collection of organized data over a period of time. For instance, a time-series study of past holiday sales data can be used to forecast future holiday demands.
Decision Trees
In data mining and machine learning, this is yet another prominent and cutting-edge categorization algorithm. A classification or regression model is represented by the decision tree, which is a tree-shaped diagram. It continually separates a data set into smaller and smaller sub-datasets (that contain instances with comparable values) while simultaneously developing an associated decision tree.
With the help of the branches, the tree is constructed to demonstrate how and why one choice may lead to the next.
In conclusion
There is no single data analysis approach or strategy that can be considered as the best data mining technique. Each one has a distinct function, meaning, benefits, and limitations. Choosing these easy data analysis methods and techniques might be a crucial point for your overall business development.
At Plumlogixu we offer a comprehensive data analytics course. Our data analytics training syllabus goes beyond the technical skills and focuses also on the skills that hiring managers are looking for -communication, problem-solving and strategic thinking.
You’ll learn from a collection of videos, review insights from industry experts like McKinsey, and handle project and case studies from leading institutions like Harvard Business School. Get mentored to ace the interviews and win the job and salary you deserve.